Organizing ideas and data
Introduction
This is in the works! Would you like to help flesh it out? Let's do it!
Just writing things down!

brainstorming, collecting ideas, or recording important points during meetings.
Provides a foundation for more organized thinking and further diagramming. doodles.
Ways to group them
Maybe you didn’t write things down in any particular grouping. you can use highlighters to color areas. You can even cut them up and paste them sowhere else -or do that digitally with a photo and graphics program. If you’re using a white board / you can rewrite them. We often write on sticky notes – or pieces of paper so we can group them on a pinup board.
Clusters
Write things in groups / use colors?
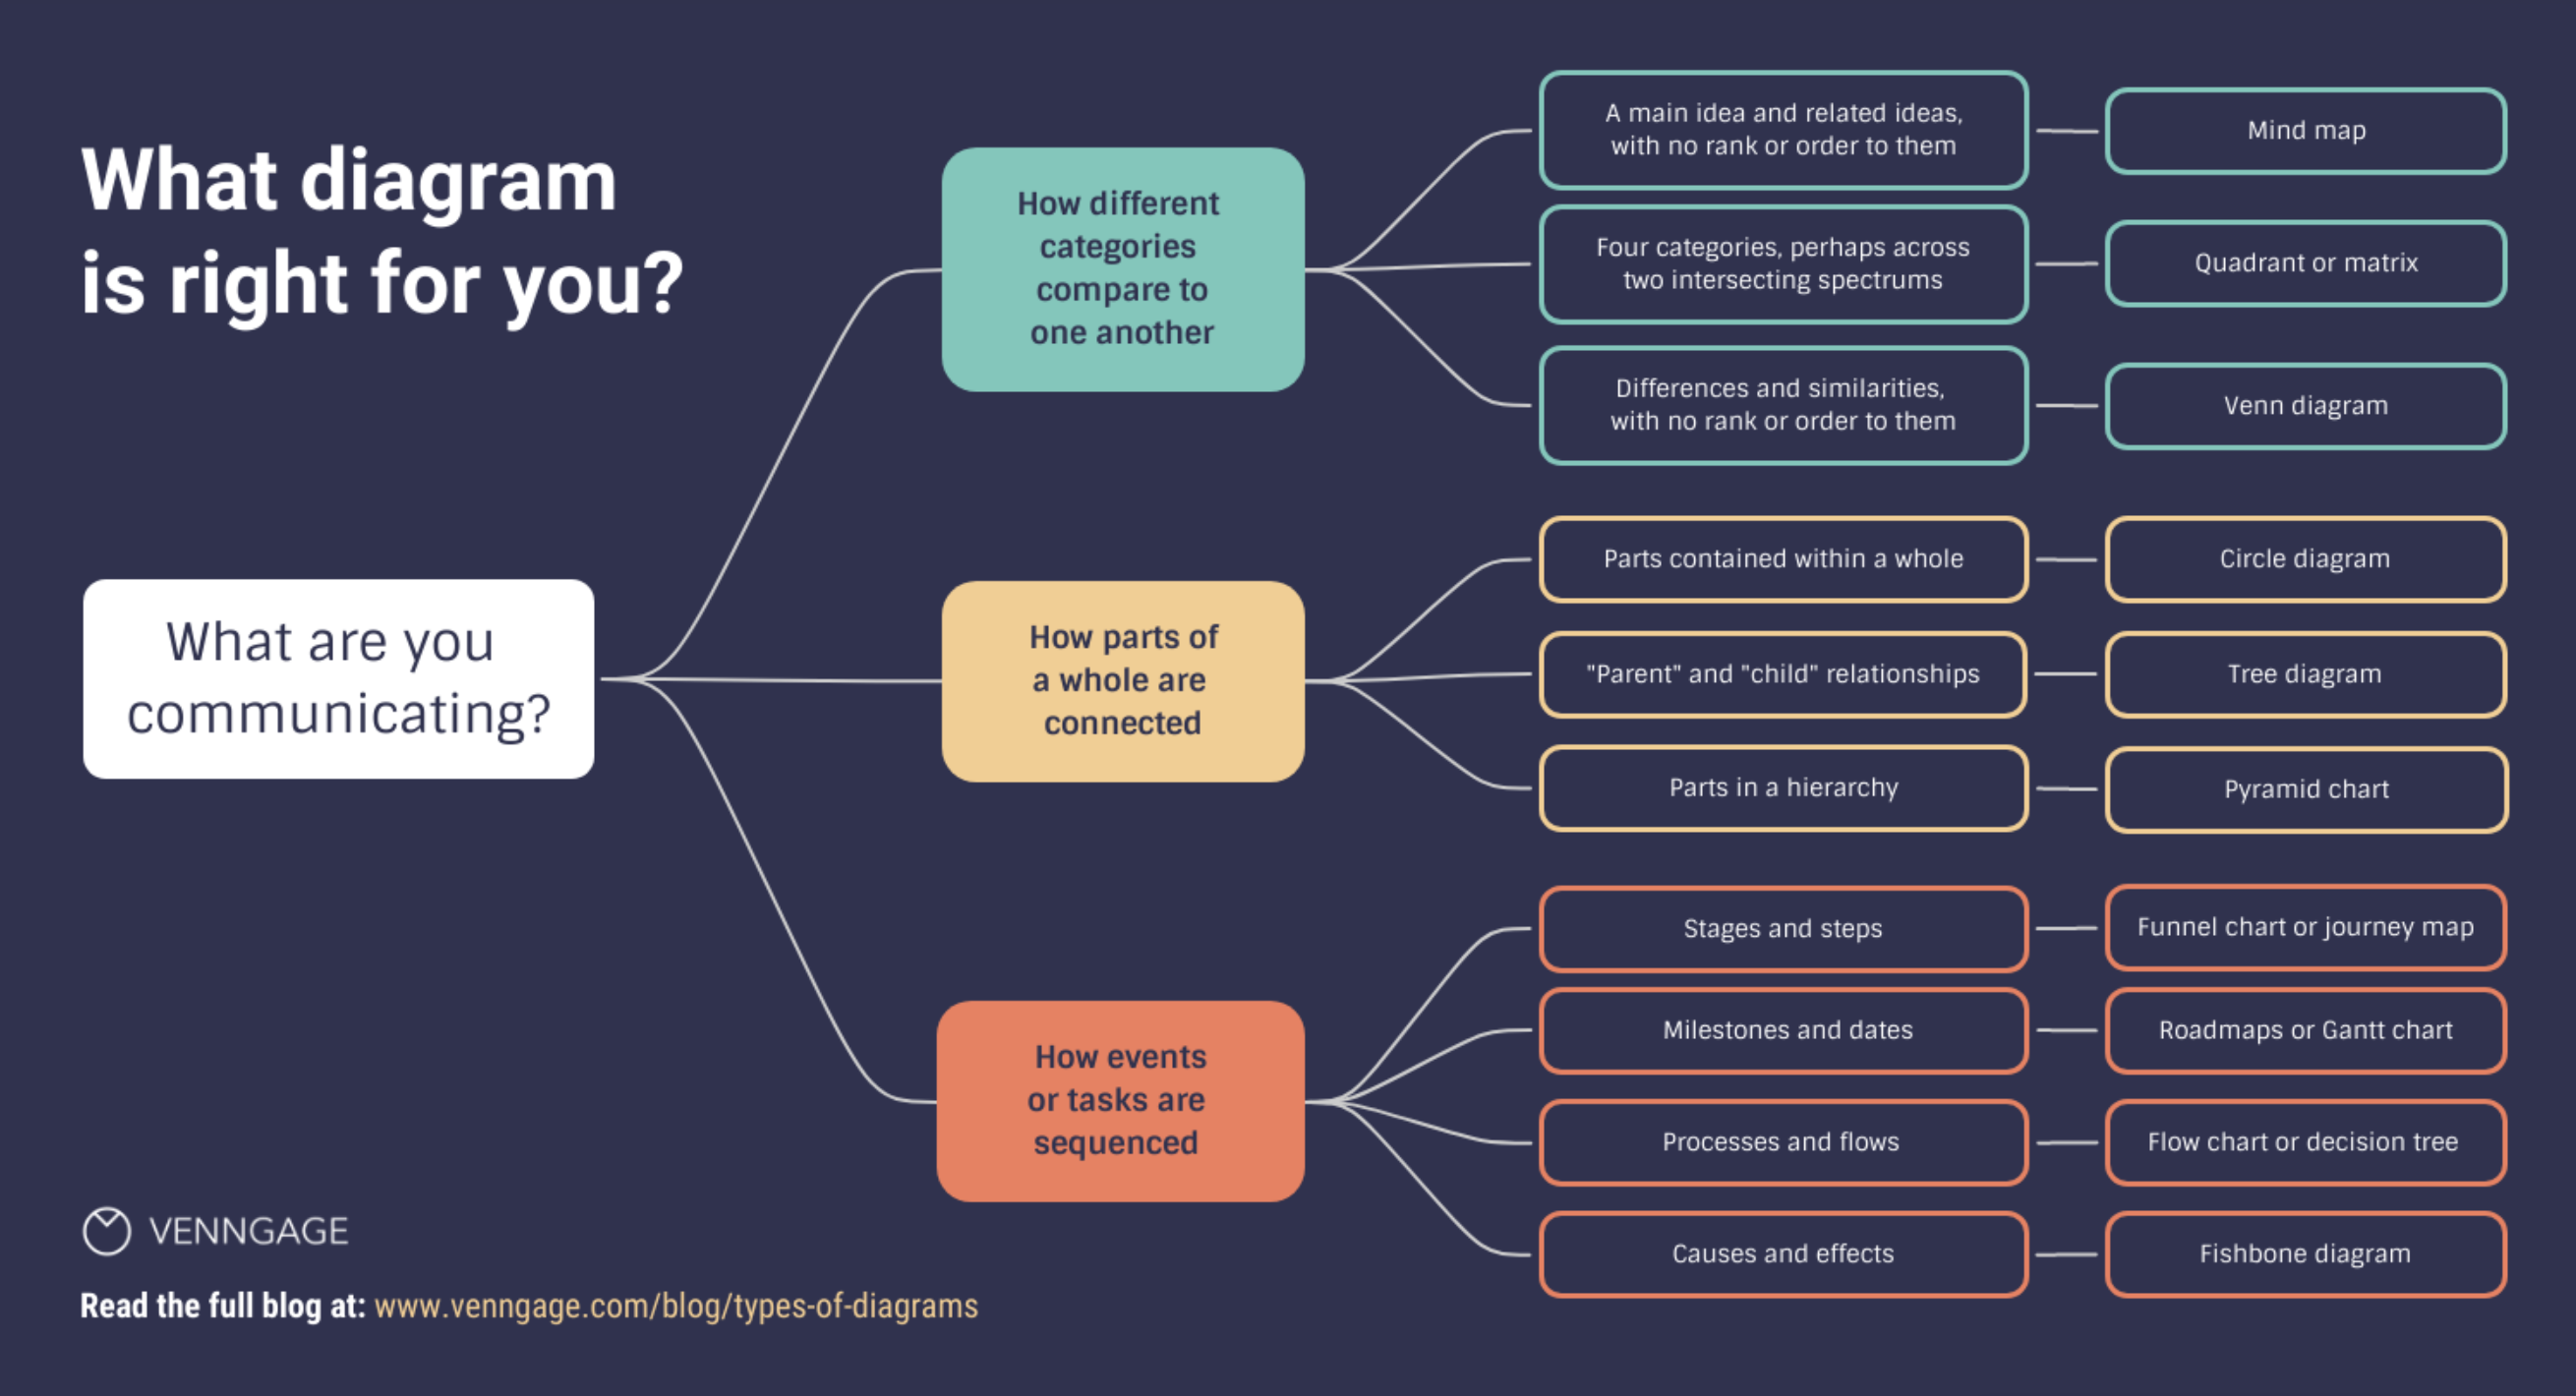
Mind maps
start with a subject and branch off
Circle diagram
displays information within or around a circle to show parts of a whole. // visualizing hierarchical data (e.g., community levels) or equally significant themes around a central concept.
Circle diagram
displays information within or around a circle to show parts of a whole. // visualizing hierarchical data (e.g., community levels) or equally significant themes around a central concept.
Tree Diagram (Dendrogram)
A hierarchical diagram with nodes representing categories or levels / Helps illustrate categories within categories, such as company roles (organizational chart) or family trees (genogram).
Flowchart, Feedback Loop, and Decision Tree
A diagram that represents a step-by-step process with decision points using shapes connected by lines or arrows / Maps user flows, process workflows, or decision-making paths.
Venn Diagram
Overlapping circles that show relationships between different categories by highlighting similarities and differences / Comparing products, services, or ideas.
Pyramid or Triangle Chart
A hierarchical diagram that shows parts of a whole in a ranked way / Often used for visualizing building blocks like Maslow’s hierarchy of needs or food pyramids.
Matrix or Quadrant Chart
A chart that plots data along two axes to create four categories / Useful for prioritizing tasks (Eisenhower Matrix), comparing internal and external factors (SWOT), or competitive analysis (Gartner Magic Quadrant).
Fishbone Diagram (Ishikawa)
A diagram shaped like a fish skeleton that shows cause-and-effect relationships. Root cause analysis for identifying factors leading to a specific outcome.
SWOT Analysis Diagram
A four-quadrant chart that outlines strengths, weaknesses, opportunities, and threats. / Used in strategic planning to evaluate an organization’s internal and external position.
Roadmap and Gantt Chart
Tools used for project planning and scheduling. Roadmaps outline major stages and goals, while Gantt charts detail task timelines and dependencies. / Roadmaps are ideal for planning strategies, while Gantt charts manage project timelines with start and end dates.
Grouping them?
1. Initial Grouping:
- Just Writing Things Down: This is your foundational step and serves as the starting point for capturing ideas and information.
- Ways to Group Them: Highlight how different groupings can be achieved using visual techniques like highlighters or sticky notes.
2. Grouping Methods:
- Clusters: Mention using colors, physical grouping, or digital tools to create clusters.
- Mind Maps: Emphasize starting from a central topic and branching out.
- Circle Diagrams: Explain using concentric circles for hierarchy or evenly spaced elements around a circle for equally weighted themes.
3. Hierarchical Visualizations:
- Tree Diagram (Dendrogram): Highlight its hierarchical nature for representing categories within categories.
- Pyramid or Triangle Chart: Note its simplicity for ranked or hierarchical data representation.
4. Process and Flow Visuals:
- Flowchart, Feedback Loop, and Decision Tree: Detail how these are used to map user flows or decision-making processes.
- Roadmap and Gantt Chart: Highlight their use in project planning with specific timelines.
5. Comparison and Analysis:
- Venn Diagram: Perfect for showcasing overlaps and differences.
- Matrix or Quadrant Chart: Emphasize its use for strategic evaluation or prioritization (e.g., SWOT analysis).
- SWOT Analysis Diagram: Show how it can be a deeper application of quadrant charts.
6. Problem Analysis:
- Fishbone Diagram (Ishikawa): Focus on its use for cause-and-effect analysis in problem-solving.
We can make a version of this — too.
Would be a fun little interactive questionnaire too –